
תקציר
In current 2026 data, a shipment of 8 CBM from Shanghai to Los Angeles costs approximately $960 via LCL, compared to about $3,200 via FCL – a saving of roughly 70% in favor of LCL. This means that in the near future, environmental costs will be a decisive factor in the economic comparison between FCL and LCL, especially for shipments to Europe. FCL vs LCL FAQ - Comprehensive Guide Open All 1 What is the difference between FCL and LCL in ocean freight?
Introduction
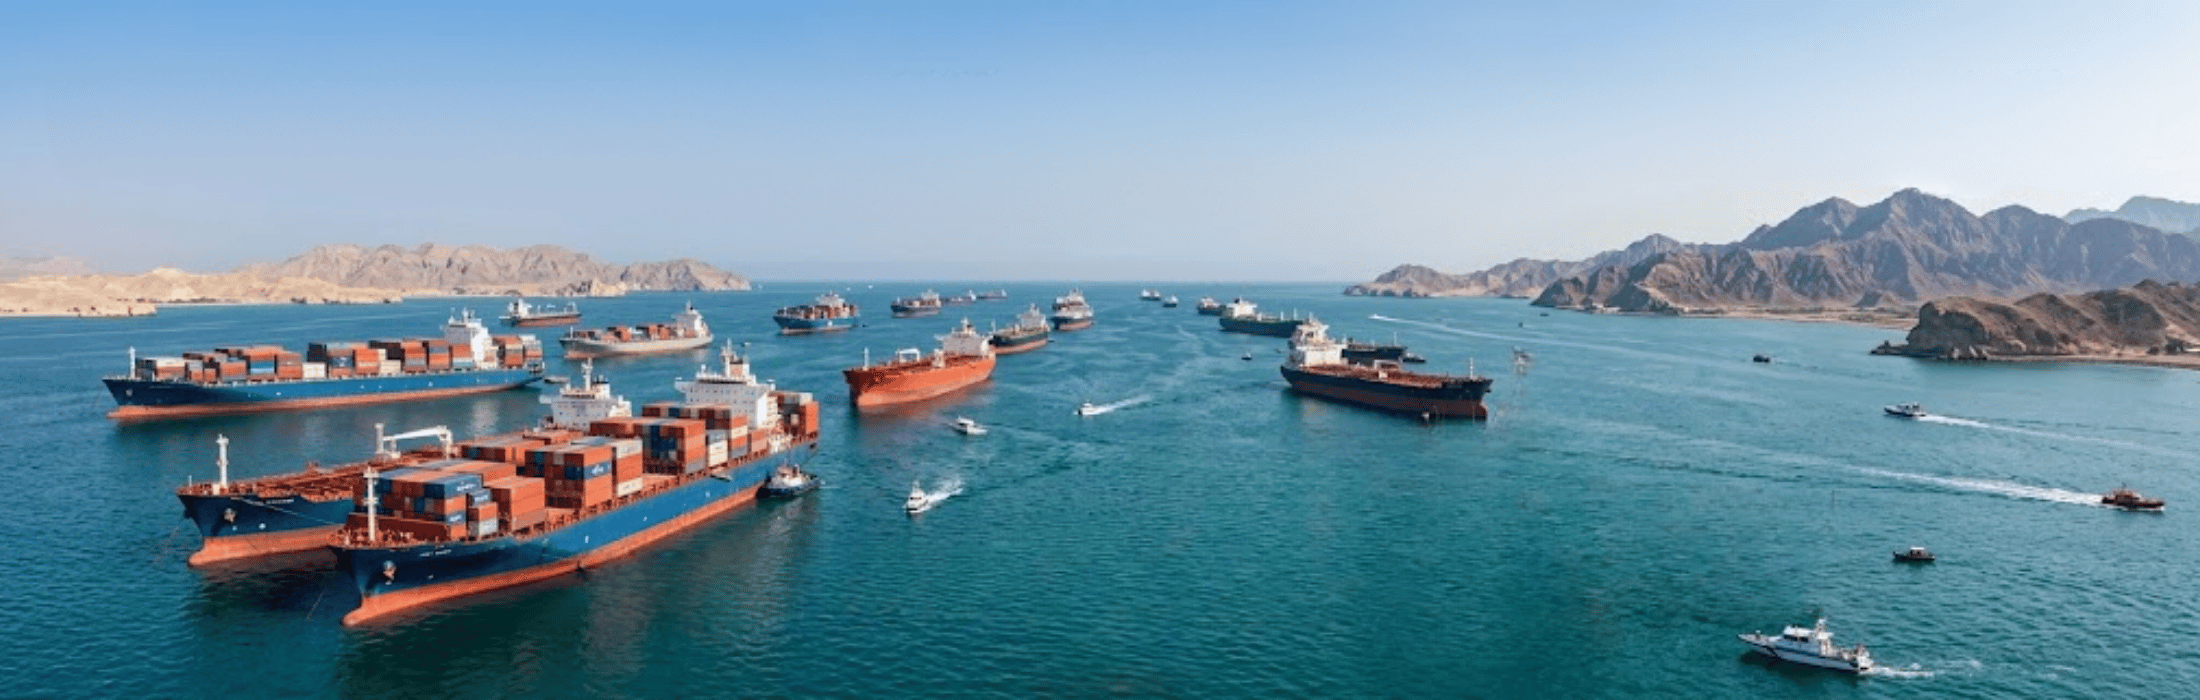
Ocean freight is the backbone of global trade, with over 80% of world trade volume carried by sea. For importers, exporters, and small to medium‑sized businesses, the decision between FCL (Full Container Load) and LCL (Less than Container Load) is not merely a technical choice. It is a strategic decision with direct implications for profitability, cash flow, and inventory management. A wrong choice can lead to thousands of dollars in unnecessary expenses. In contrast, a deep understanding of the cost structure can save businesses tens of percent in shipping costs. This article provides a comprehensive economic analysis, based on leading institutional and academic sources, and equips you with the tools to make the optimal decision for your business.
Understanding the Basic Shipping Models
What is Full Container Load (FCL)?
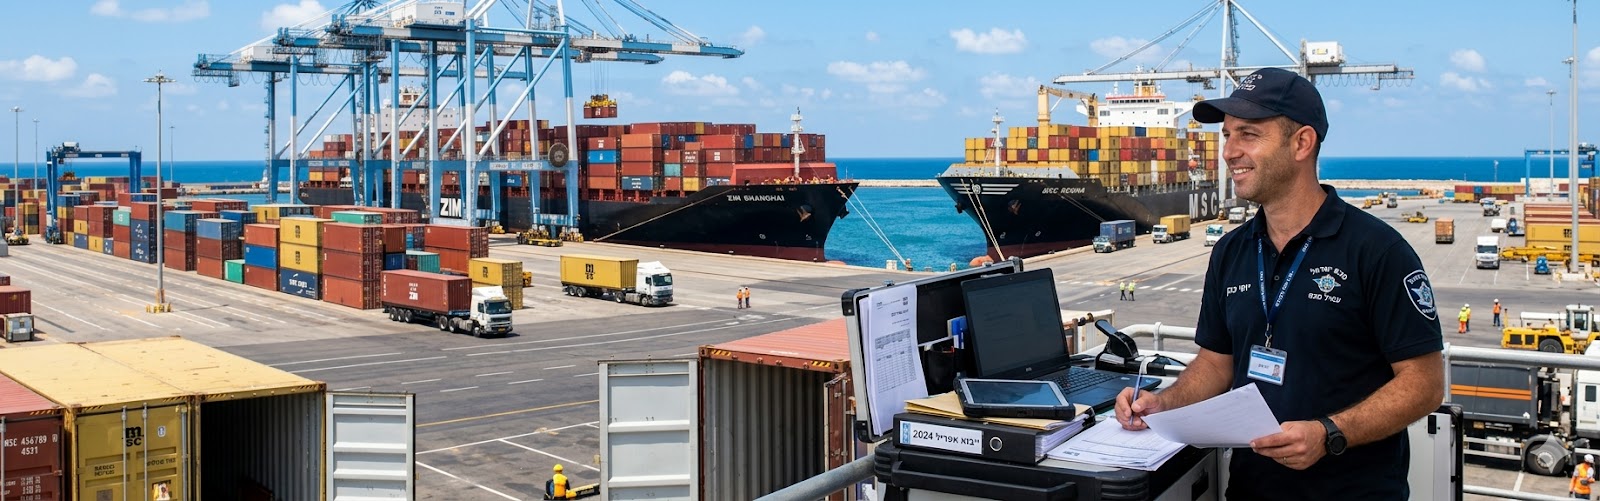
FCL is a shipping model where a single shipper’s cargo occupies an entire container, even if the cargo does not completely fill it. Under this model, the container is sealed at origin and opened at destination, reducing touch points and improving security. Major global carriers, such as Maersk, note that FCL is especially suitable for large shipments, time‑sensitive or high‑value goods, and businesses that prefer a predictable and simple shipping process.
What is Less than Container Load (LCL)?
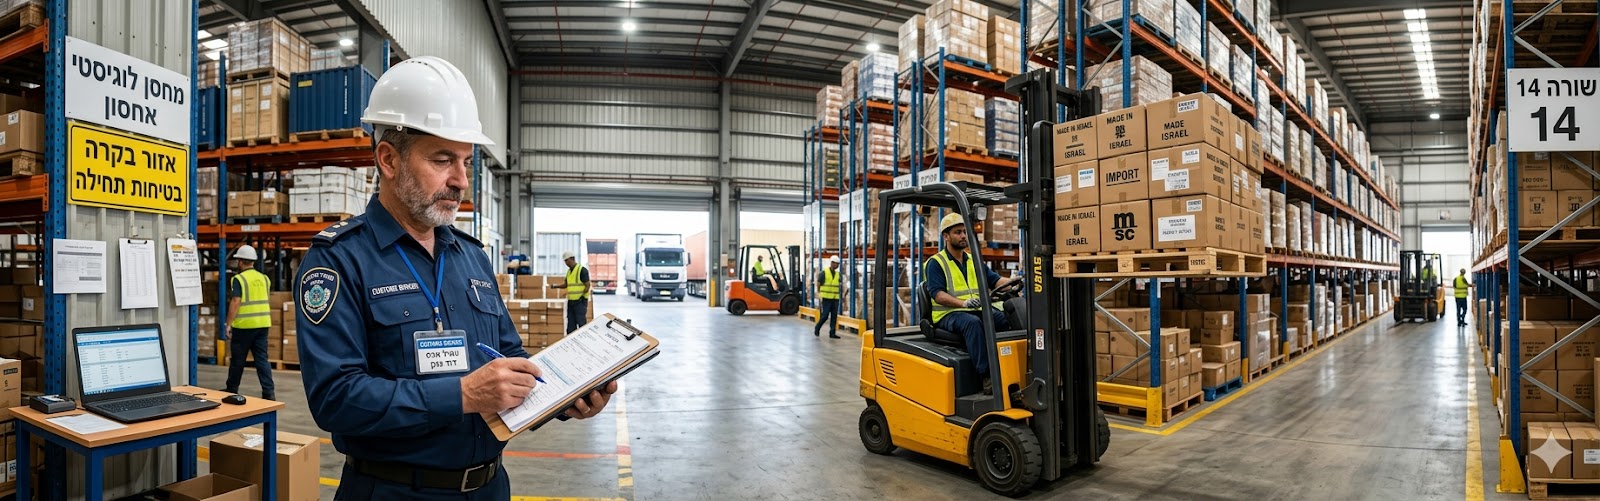
LCL is a shipping model where cargo from multiple different shippers is consolidated inside one container. This model allows businesses with small quantities to pay only for the volume they occupy, without needing to rent an entire container. However, the shipment goes through consolidation and deconsolidation, which adds handling steps and may extend delivery times. According to DHL analyses, LCL is an excellent solution for small and medium‑sized businesses, occasional importers, and those wanting to test new markets without a large upfront investment.
Detailed Cost Components of Each Model
FCL Cost Structure
Full Container Load shipping is priced at a fixed rate per container, regardless of the exact volume inside. The main cost components include fixed ocean freight per container type, terminal handling charges at origin and destination, documentation and customs fees, trucking (haulage) to and from the port, and various surcharges such as bunker adjustment, seasonal surcharges, or port congestion fees. According to Drewry data, ocean freight rates in early 2026 show significant volatility, with the World Container Index rising 16% in the first week of January to reach $2,557 per 40‑foot container.
LCL Cost Structure
In contrast to FCL, LCL shipping is mainly charged by volume in cubic meters (CBM), and in some cases by weight or the higher of the two (W/M – Weight or Measurement). The cost components in LCL are more complex and include a base rate per CBM, consolidation and deconsolidation fees, terminal handling charges at both ends, documentation fees, and sometimes a minimum charge even for very small volumes. According to estimates based on Q4 2025 data, LCL rates range between $100 and $150 per CBM on major lanes, such as from Asia to the United States.
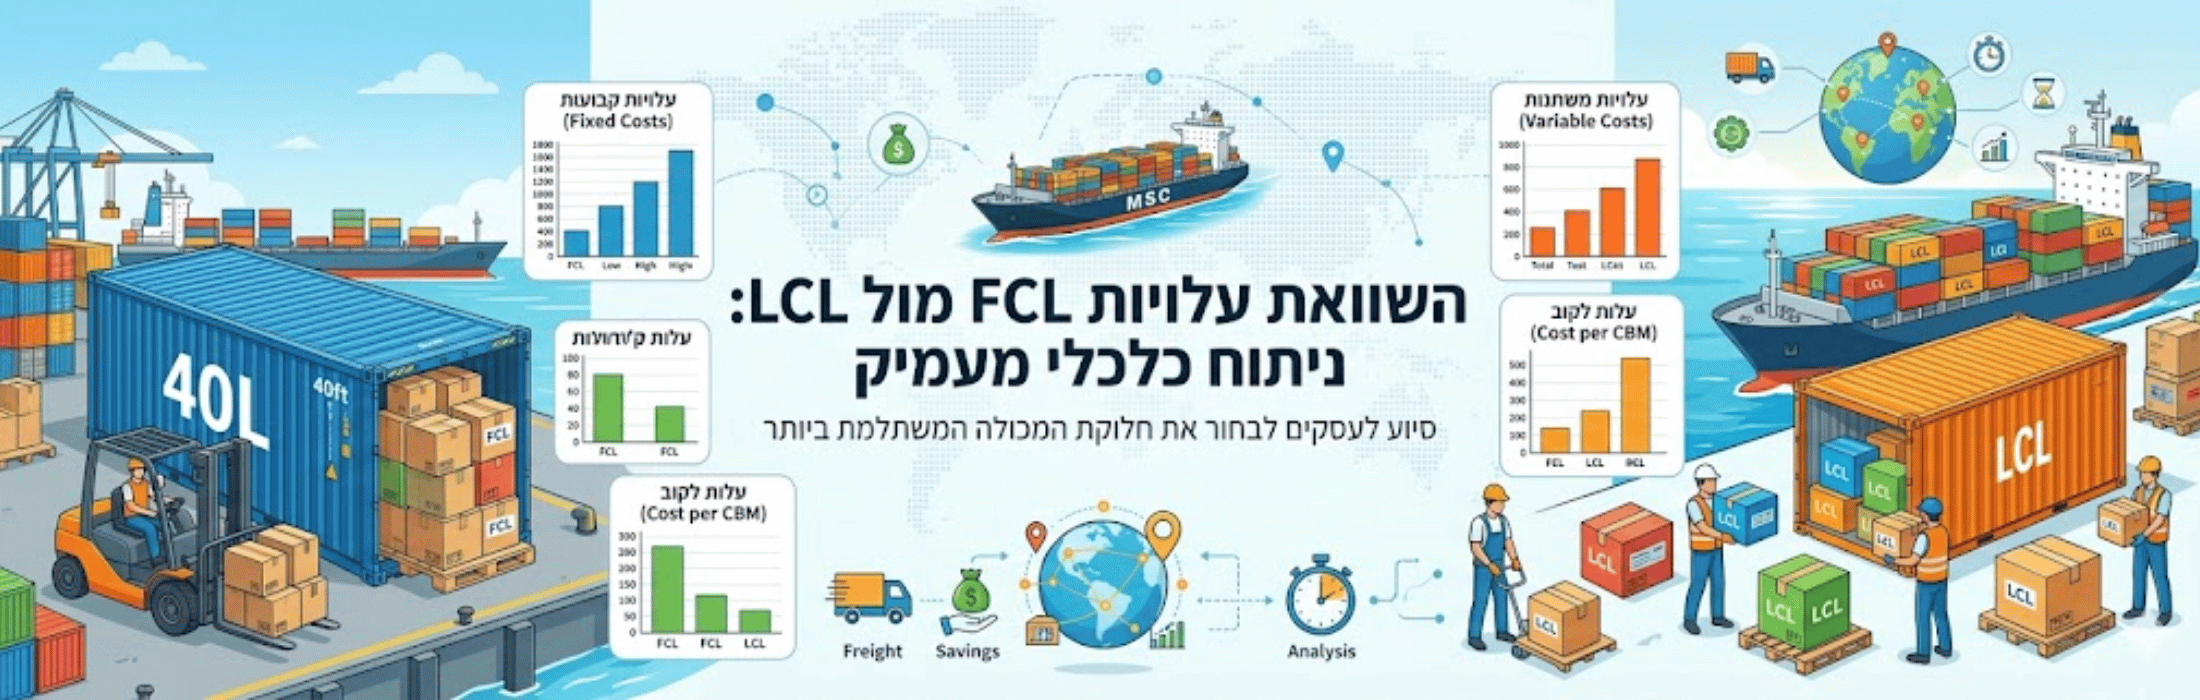
Full Comparison Table: FCL vs LCL
| Parameter | FCL (Full Container Load) | LCL (Less than Container Load) |
|---|---|---|
| Pricing method | Fixed rate per container | Variable rate per CBM and sometimes weight |
| Cost per unit | Decreases as volume increases | Higher per CBM, no volume advantage |
| Delivery time reliability | High – fewer handlings | Lower – consolidation and deconsolidation delays |
| Risk of damage or loss | Low – minimal handling | Higher – multiple handlings |
| Operational flexibility | Suitable for stable volumes | Suitable for small, frequent shipments |
| Customs and documentation complexity | Simple – one Bill of Lading | Complex – house and master bills |
| Availability in peak seasons | Limited – high demand | Higher – flexibility in space sharing |
| Working capital requirement | High – pay for entire container | Low – pay only for space used |
The Economic Break‑Even Point
When is LCL More Cost‑Effective?
LCL is the most cost‑effective solution for small shipments, typically up to 10‑15 cubic meters. In current 2026 data, a shipment of 8 CBM from Shanghai to Los Angeles costs approximately $960 via LCL, compared to about $3,200 via FCL – a saving of roughly 70% in favor of LCL. However, it is important to note that LCL becomes more expensive than FCL when the cargo reaches 12‑15 cubic meters, due to the additional consolidation, deconsolidation, and handling fees. In practice, the common recommendation among shipping experts is that LCL suits shipments up to 15 CBM, FCL is better for shipments above 20 CBM, and in the 15‑25 CBM range, a careful quote comparison is essential.
Calculating the Actual Break‑Even Point
To accurately calculate the break‑even point between FCL and LCL for your business, perform the following simple calculation. First, multiply your cargo volume (in CBM) by the LCL rate per CBM (including all surcharges). Second, add to the fixed FCL price the inland transport and ancillary costs. Third, compare the two totals and find the volume where the FCL price becomes lower. It is advisable to perform this calculation for each shipping lane separately, as rates vary significantly between destinations and even between seasons.
Decision Factors Beyond Price
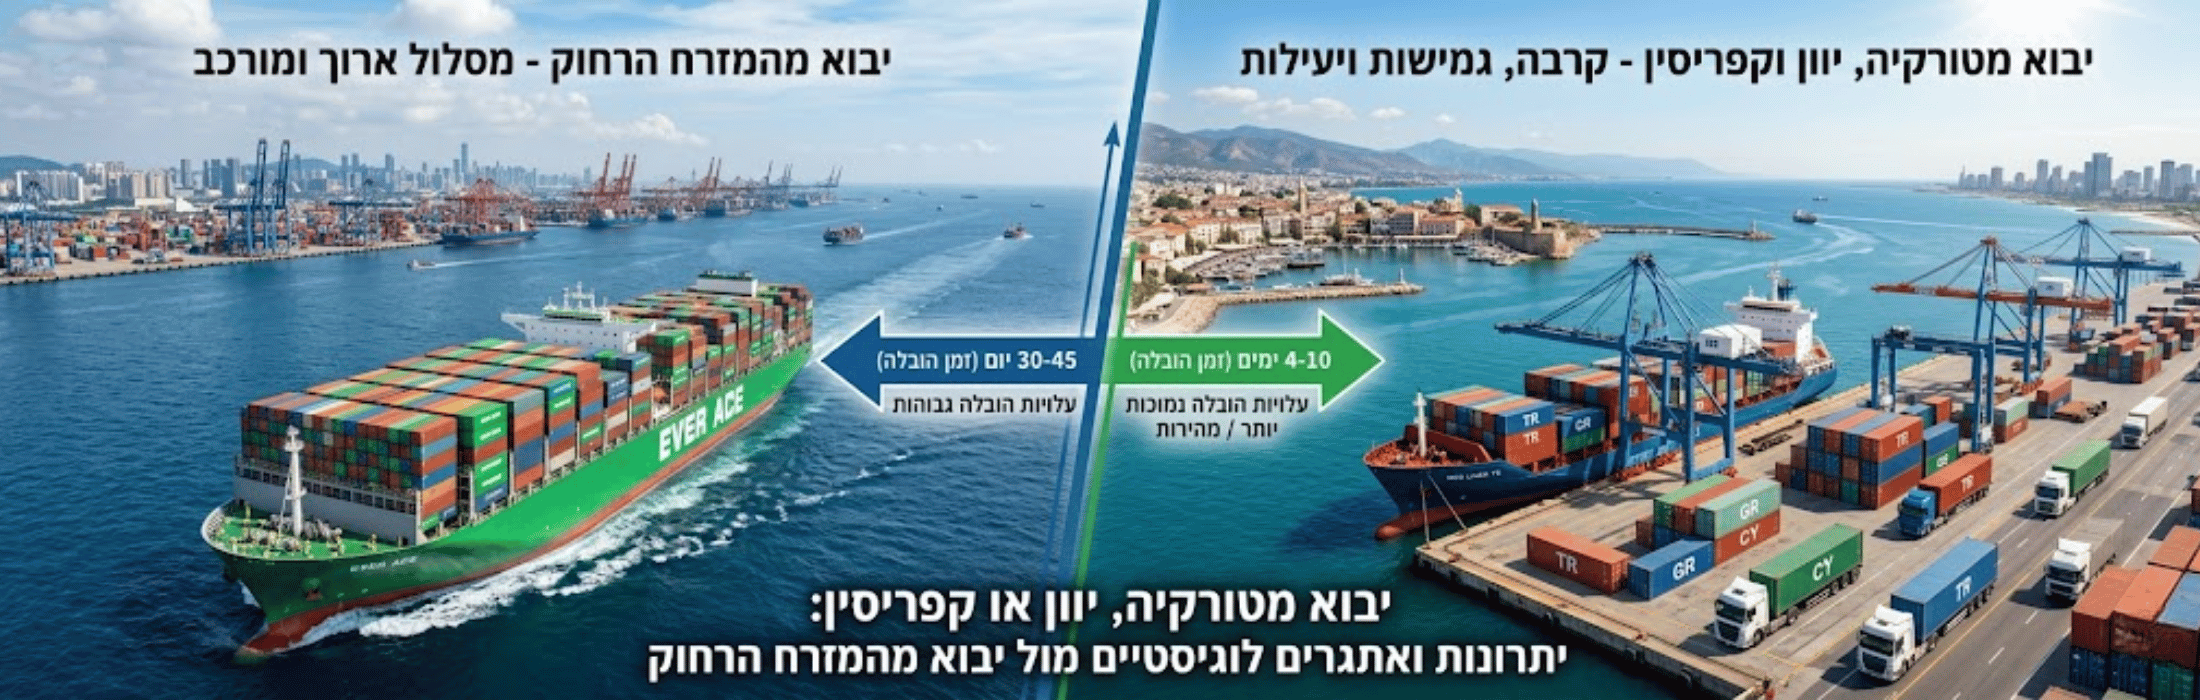
Transit Times and Reliability
Transit time is a critical parameter that does not always receive enough weight in the decision process. While the basic sailing time is similar in both models, LCL adds several days for consolidation and deconsolidation processes. When an LCL shipment arrives at the destination port, you must wait for the entire container to be unloaded, the cargo to be sorted, and your specific cargo to be released. This delay can add 3‑7 working days, and even more in congested ports. In contrast, under FCL the entire container is unloaded and released immediately, providing much greater certainty for managing production or sales schedules.
Risks and Insurance
In the LCL model, your cargo is unloaded and repacked at the consolidation center, which increases the number of touch points and raises the risk of damage, loss, or mixing with other cargo. Moreover, when multiple shippers’ cargo shares the same container, damage to one shipper’s goods may affect everyone. Maersk reports sharp increases in cargo insurance premiums in the Middle East region, with increases of up to 450% in insurance costs in Israel and the UAE due to elevated risk of damage. FCL, on the other hand, offers a higher level of security and complete separation from other cargo, significantly reducing risks and associated insurance costs.
Inventory Management and Working Capital
The choice between FCL and LCL directly affects the business’s working capital requirements. FCL requires purchasing a larger volume of goods per shipment, increasing inventory investment and straining cash flow in the short term. However, the lower unit cost in FCL improves gross profitability in the long run. In contrast, LCL allows smaller, more frequent shipments, reducing required inventory and improving business liquidity, albeit at a higher unit cost. Businesses with sharp seasonality or limited cash flow will find LCL a flexible and more adapted solution.
Example Scenario Analysis
Scenario 1: Small Electronics Importer
A small Israeli importer of electronic accessories wants to import an initial volume of 4 CBM from China to Israel. According to a current price list, the LCL cost for this volume ranges from $50 to $80 per CBM, total $200‑320. In comparison, an FCL 20‑foot container costs between $1,500 and $3,000, depending on destination and carrier. In this case, LCL is tens of percent cheaper and allows the importer to test the market without significant financial risk. Moreover, the importer can introduce new products more frequently, adapt inventory to changing demand, and avoid high storage costs. LCL enables the small importer to compete effectively against larger players.
Scenario 2: Established Furniture Exporter
An Israeli furniture exporter to Europe exports a monthly volume of 25 CBM of packed goods. The LCL cost for this volume, at a rate of $150 per CBM, would reach about $3,750. In comparison, the FCL cost for a 40‑foot container ranges from $2,900 to $4,500, with an average around $3,200. In this case, FCL is at least 15% cheaper and faster, because the whole container moves directly from port to port without consolidation and deconsolidation. Additionally, the higher security level of FCL reduces damage risks for large, expensive products. For an exporter with steady flow, FCL is the most profitable solution.
2026 Trends Affecting Freight Rates
Fuel Price Volatility and Geopolitical Impacts
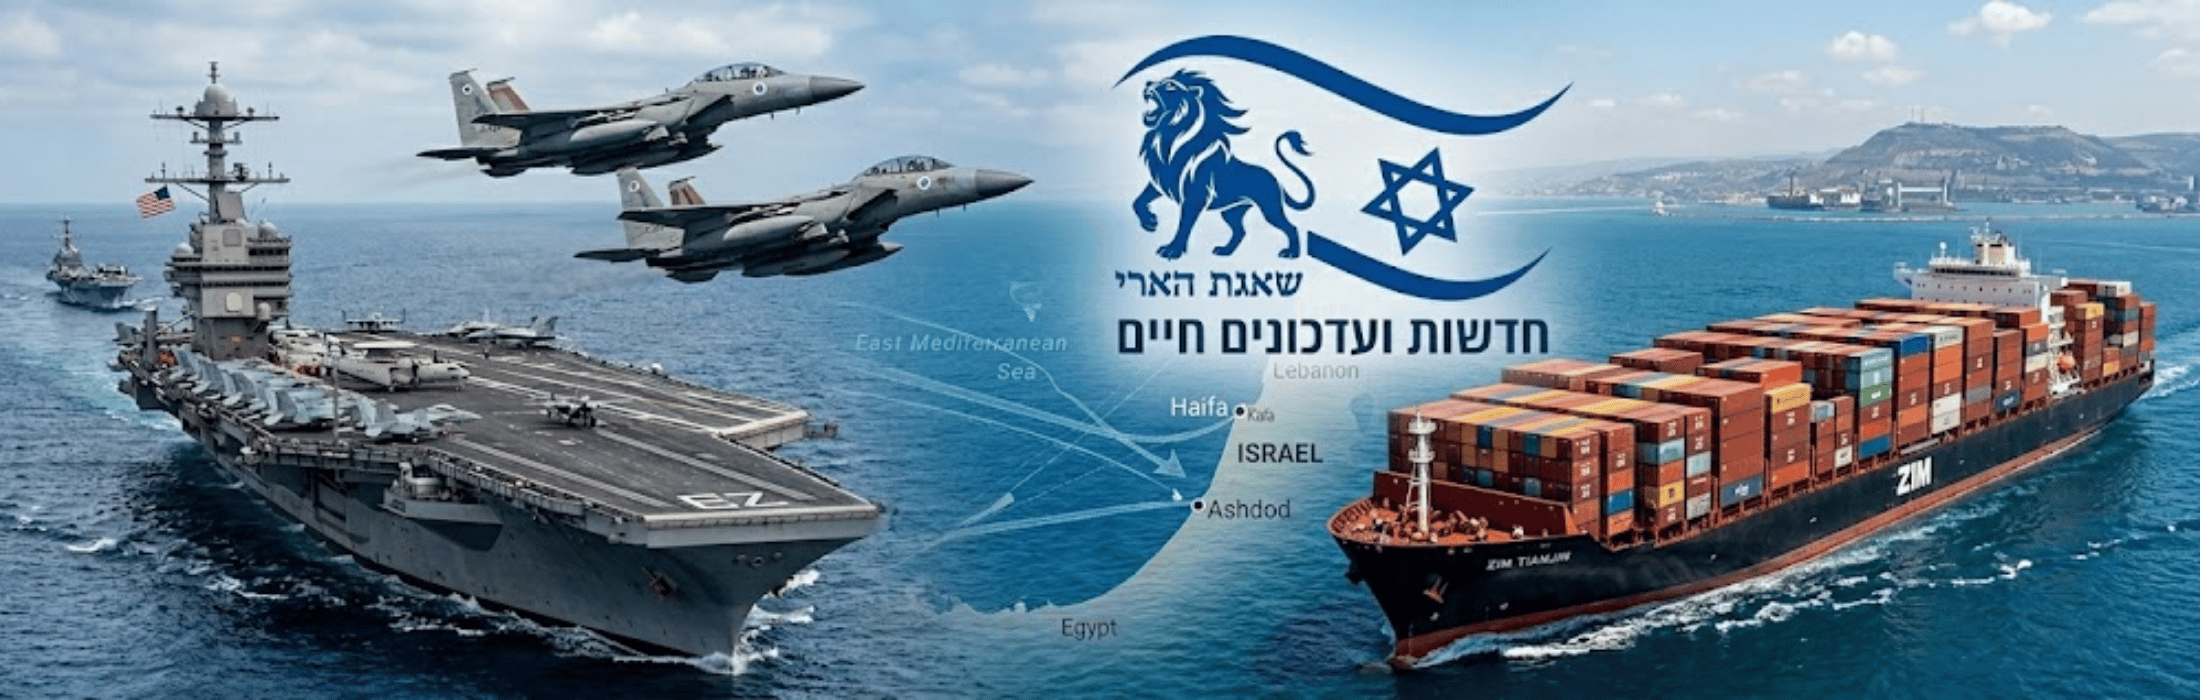
The year 2026 is marked by unprecedented volatility in the ocean freight market. According to Drewry reports, the World Container Index stood at $2,309 per 40‑foot container in early April 2026, up 1% for the week but below the January peak of $2,557. Fuel costs remain a major driver of volatility, as uncertainty in the Strait of Hormuz – through which about 20% of global oil supply passes – forces carriers to impose emergency surcharges. Maersk, for example, has requested approval to impose an emergency fuel surcharge of $200 per TEU on major routes, indicating significant cost pressures.
Environmental Regulation and EU Carbon Tax
The EU Emissions Trading System (EU ETS), which has included the shipping sector since January 2024, is a growing cost factor in 2026. According to Searoutes analysis, EU ETS surcharges currently account for 6‑7% of the basic freight cost for dry containers from Asia to Northern Europe, averaging $168 per 40‑foot container. If the Red Sea routes reopen and rates fall, this share could rise to 12% or even more of total costs. This means that in the near future, environmental costs will be a decisive factor in the economic comparison between FCL and LCL, especially for shipments to Europe.
Supply and Demand Market Developments
The global container market in 2026 is in a period of supply‑demand convergence. After years of rapid capacity growth, new vessel deliveries are expected to drop in 2026 to 1.48 million TEUs, a decrease of 17.7% from 2025. Global fleet capacity growth is forecast at only 2‑4%, down sharply from the 7% seen in 2025. Meanwhile, UNCTAD projects global maritime trade will grow at an average annual rate of 2% between 2026 and 2030, and container trade by 2.3%. This convergence may bring some stabilisation after years of extreme volatility, but also intensified competition among carriers, who will need to balance rate reductions with profitability.
Summary and Practical Recommendations
The choice between FCL and LCL is a multi‑variable business decision, extending far beyond a simple rate comparison. A deep economic analysis requires consideration of all cost components, transit times, logistical risks, working capital impacts, and alignment with your specific business needs. LCL offers flexibility, lower upfront cost, and operational convenience for small and medium‑sized businesses, but at the price of higher unit cost, longer delivery times, and increased handling risks. FCL, in contrast, provides significantly lower unit cost, high reliability, and faster transit, but requires a larger capital investment, careful inventory planning, and commitment to large volumes.
The practical recommendation for businesses operating in the Israeli market is to perform a periodic cost‑benefit analysis for each product or product line separately. For initial imports or testing a new market, LCL is the ideal solution. For products with stable demand and monthly volume exceeding 15 CBM, FCL will be significantly more profitable in the long term. In many cases, a combined strategy – FCL for high‑volume components and LCL for niche or seasonal products – will yield the best business outcome. It is recommended to consult with shipping experts and request quotes from several carriers before each decision, checking all surcharges and ancillary fees. An informed choice between FCL and LCL is not just immediate cost savings; it is a cornerstone of your business’s competitiveness in the global market.
FCL vs LCL: Frequently Asked Questions
FCL (Full Container Load) is a model where a single shipment occupies an entire container, sealed at origin and opened at destination. LCL (Less than Container Load) is a model where cargo from multiple shippers is consolidated inside one container, going through consolidation and deconsolidation processes. While FCL offers higher speed and security, LCL suits small shipments with operational flexibility.
LCL is more cost-effective for small shipments up to 10-15 cubic meters. For example, an 8 CBM shipment from Shanghai to Los Angeles costs about $960 via LCL compared to $3,200 via FCL – a saving of roughly 70%. However, above 15 CBM, LCL becomes more expensive due to additional consolidation, deconsolidation, and handling fees.
The main cost components of FCL include fixed ocean freight per container, terminal handling charges at origin and destination, documentation and customs fees, trucking (haulage) to and from the port, and various surcharges such as bunker adjustment, seasonal surcharges, or port congestion fees.
LCL cost components include a base rate per CBM (cubic meter), consolidation and deconsolidation fees, terminal handling charges at both ends, documentation fees, and sometimes a minimum charge for very small volumes. Pricing is based on volume or weight – whichever is higher (W/M – Weight or Measurement).
The break-even point is the volume at which the total cost of FCL equals that of LCL. For most lanes, this point ranges between 15 and 20 CBM. Up to that point, LCL is cheaper because you pay only for the volume needed. Beyond it, FCL becomes more cost-effective due to the fixed container rate spreading over larger volume, lowering the cost per unit.
Additional benefits of FCL include higher delivery time reliability (fewer touch points), lower risk of damage or loss, simpler customs process with a single Bill of Lading, full control over container packing, and faster cargo release at the destination port. This model is especially suitable for sensitive or high-value cargo.
LCL offers small and medium-sized businesses significant advantages: lower upfront cost (pay only for the volume needed), high operational flexibility allowing frequent small shipments, lower working capital requirements, and the ability to test new markets without a large upfront investment. LCL also enables leaner inventory management and quick adaptation to demand changes.
Fuel surcharges (BAF – Bunker Adjustment Factor) and environmental regulations like the EU ETS (Emissions Trading System) account for a growing share of freight costs. As of 2026, EU ETS surcharges represent 6-7% of the basic freight cost for dry containers from Asia to Northern Europe, averaging $168 per 40-foot container. If Red Sea routes reopen, this share could rise to 12% or even more of total costs.
FCL requires purchasing a larger volume per shipment, increasing inventory investment and straining short-term cash flow, but improves long-term gross profitability. LCL allows smaller, more frequent shipments, reducing required inventory and improving liquidity, but at a higher unit cost. The choice depends on the business's working capital capacity and demand patterns.
An informed choice is based on a multi-variable analysis including cargo volume and monthly turnover, product sensitivity to time and damage, working capital requirements, seasonality and demand patterns, comparing quotes from several carriers including all surcharges and ancillary fees, and considering a combined strategy (e.g., FCL for high-volume components and LCL for niche products). It is recommended to perform a periodic cost-benefit analysis for each product line separately.