





50 Facts About Imports to Israel in 2026
In 2025, Israel imported approximately USD 95.5 billion in goods, about two-thirds by sea. China was the largest individual country of origin (USD 20.8 billion), while Europe was the largest regional source (46% of imports). Standard commercial import declarations took an average of approximately 65 hours to clear, and the merchandise trade deficit reached NIS 103.1 billion in January–August 2026.
This page brings together 50 key facts about imports to Israel: how much is imported, from where, by which transport mode, how long customs clearance takes, and the state of the trade deficit. Each figure is accompanied by an institutional source and publication date for verification, citation and comparison. The page is updated as new figures become available.
Imports to Israel: 2025 in Numbers
The most recent full year with relatively final figures is 2025. The data show rising imports and falling exports, widening the gap between them.
- 195.5 billion USD
Total merchandise imports to Israel in 2025, up 3.9% from 2024.
Source: Israel Central Bureau of Statistics – Imports and Exports by Transport Mode, 2025 · June 2026 [1] - 258.6 billion USD
Total merchandise exports in 2025, down 2.7% from 2024.
Source: Israel Central Bureau of Statistics – Imports and Exports by Transport Mode, 2025 · June 2026 [1] - 3320 billion NIS
Goods imports excluding diamonds in 2025 (approximately USD 101 billion at the exchange rate used in the release).
- 4131.7 billion NIS
The merchandise trade deficit excluding diamonds in 2025, approximately USD 41 billion.
- 542.6 billion USD
Imports of raw materials excluding diamonds and energy products in 2025, approximately USD 3 billion more than the preceding year.
- 626.3 billion USD
Imports of consumer goods in 2025, an increase of approximately 6%.
- 715.4 billion USD
Imports of investment goods excluding ships and aircraft in 2025, an increase of nearly 8%.
- 8106.6 billion USD
The highest import figure of the past decade was recorded in 2022 according to the OECD; the comparable figure for 2025 was USD 94.9 billion.
Source: OECD – International Merchandise Trade Statistics, Israel (via FRED) · 16.3.2026 [7]
What the Figures Tell Us
In 2025, Israel imported approximately USD 95.5 billion in merchandise and exported USD 58.6 billion [1]. Exports therefore covered only about 61% of imports. These figures concern goods alone: service exports, particularly software, are excluded. The merchandise deficit therefore does not by itself describe the economy’s entire external balance. [1]
The composition of imports provides insight into the economy. Raw materials are the largest category, at approximately USD 42.6 billion, supporting domestic industry. Consumer goods (USD 26.3 billion) and investment goods (USD 15.4 billion) both increased, pointing to domestic demand and investment in machinery and equipment [2]. [2]
How Goods Arrive: Sea, Air and Ports
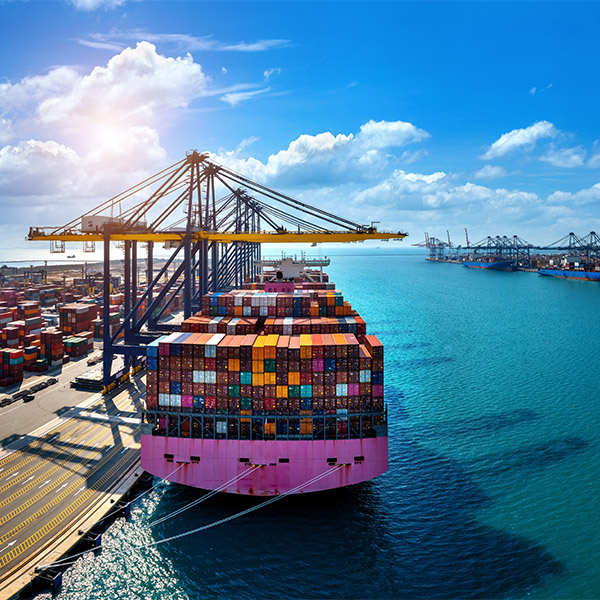
Most imports by value arrive by ship, but not all. Roughly one-third arrive by air, often lighter, high-value products. By weight, almost all international goods traffic passes through seaports.
- 966.7%
Share of imports arriving by sea in 2025 (USD 63.6 billion), compared with 67.1% in 2024.
Source: Israel Central Bureau of Statistics – Imports and Exports by Transport Mode, 2025 · June 2026 [1] - 1032.1%
Share of imports arriving by air in 2025 (USD 30.7 billion). Other transport modes accounted for only 1.2%.
Source: Israel Central Bureau of Statistics – Imports and Exports by Transport Mode, 2025 · June 2026 [1] - 1112.9%
Share of vehicles and vehicle parts in seaborne imports, the largest category in 2025.
Source: Israel Central Bureau of Statistics – Imports and Exports by Transport Mode, 2025 · June 2026 [1] - 1212.3%
Share of mineral fuels in total seaborne imports in 2025.
Source: Israel Central Bureau of Statistics – Imports and Exports by Transport Mode, 2025 · June 2026 [1] - 139.5%
Share of machinery, mechanical appliances and computer equipment in seaborne imports in 2025.
Source: Israel Central Bureau of Statistics – Imports and Exports by Transport Mode, 2025 · June 2026 [1] - 14approx. 99%
Approximate share of goods by weight imported into or exported from Israel through seaports.
- 153.44 million TEU
Container throughput at Israeli ports in 2025, up approximately 13.5% from 2024.
- 164.2%
Growth in cargo tonnage handled by seaports in 2025 compared with 2024.
Why It Matters to Importers
Two-thirds of imports by value arrive by sea, and container traffic at Israeli ports grew at a double-digit rate in 2025 [9]. For importers, port congestion can translate directly into delays and storage costs. Approximately one-third of import value arrives by air, including electronics, medical equipment and pharmaceuticals. [9]
Vehicles are the largest category of seaborne imports, accounting for 12.9% of value [1]. This illustrates the importance of Haifa and Ashdod ports for vehicle unloading and the sensitivity of consumer prices to changes in ocean freight rates. [1]
Where Israel Imports From: Countries and Regions
Europe remains the largest trading region, but China is the largest individual source country. The distinction between country of purchase and country of origin changes the picture, particularly for China.
- 1746%
Share of European countries in merchandise imports excluding diamonds in 2025.
- 1833%
Share of Asian countries in merchandise imports in 2025.
- 1912% and 9%
Shares of the Americas and the rest of the world in imports in 2025, respectively.
- 2020.8 billion USD
Imports of goods originating in China, excluding diamonds, in 2025, up approximately 8.9% from 2024.
Source: Israel Central Bureau of Statistics – Imports by Country of Origin, 2025 · 28.5.2026 [3] - 216.1 billion USD
Difference between imports from China measured by country of origin and by country of purchase in 2025, the largest gap among all countries.
Source: Israel Central Bureau of Statistics – Imports by Country of Origin, 2025 · 28.5.2026 [3] - 2224.1%
China’s share of seaborne imports to Israel in 2025, compared with 23% in 2024.
Source: Israel Central Bureau of Statistics – Imports and Exports by Transport Mode, 2025 · June 2026 [1] - 2320.4%
The United States’ share of imports by air in 2025, the largest origin for air imports.
Source: Israel Central Bureau of Statistics – Imports and Exports by Transport Mode, 2025 · June 2026 [1] - 2417.6% and 6.3%
China’s and Germany’s shares of air imports in 2025, ranking second and third.
Source: Israel Central Bureau of Statistics – Imports and Exports by Transport Mode, 2025 · June 2026 [1] - 2513.53 billion USD
Imports from China by country of purchase in 2024, a record that made China Israel’s largest import source for a fifth consecutive year.
Source: Israel Central Bureau of Statistics – Foreign Trade by Country, 2024 · 21.1.2025 [6] - 2614.5%
China’s share of total imports to Israel in the first half of 2025.
- 2731.7%
The European Union’s share of Israel’s total merchandise trade in 2025, representing EUR 43.3 billion.
Source: European Commission – EU trade relations with Israel · 2026 [14]
Country of Purchase vs. Country of Origin
The Central Bureau of Statistics publishes two measures: country of purchase (where the seller is located) and country of origin (where the goods were produced). The difference is particularly significant for China and reflects international trading and distribution channels. [3]
When comparing figures from different sources, always check which definition is used. An import figure measured by country of purchase should not be directly compared with one measured by country of origin.
2026 in Real Time: Monthly Imports and Trade Deficit
Monthly data for 2026 show continued import growth, with a particularly sharp increase in August. All amounts in this section are in shekels, excluding diamonds unless otherwise stated.
- 2825.9 billion NIS
Merchandise imports in January 2026. The merchandise trade deficit that month was NIS 9.9 billion.
Source: Israel Central Bureau of Statistics – Israel’s Foreign Trade, January 2026 · 12.2.2026 [4] - 2926.2 billion NIS
Merchandise imports in March 2026, with a deficit of NIS 9.8 billion.
Source: Israel Central Bureau of Statistics – Monthly Foreign Trade Releases, 2026 · April–September 2026 [5] - 3028.2 billion NIS
Merchandise imports in May 2026, versus NIS 27.4 billion in May 2025. The monthly deficit was NIS 10.7 billion.
Source: Israel Central Bureau of Statistics – Monthly Foreign Trade Releases, 2026 · April–September 2026 [5] - 3128.9 billion NIS
Merchandise imports in July 2026, compared with exports of NIS 16.6 billion and a deficit of NIS 12.4 billion.
Source: Israel Central Bureau of Statistics – Monthly Foreign Trade Releases, 2026 · April–September 2026 [5] - 3233.3 billion NIS
Merchandise imports in August 2026, versus exports of just NIS 16.0 billion and a monthly deficit of NIS 17.3 billion.
Source: Israel Central Bureau of Statistics – Monthly Foreign Trade Releases, 2026 · April–September 2026 [5] - 33103.1 billion NIS
Cumulative merchandise trade deficit in January–August 2026, compared with NIS 90.8 billion in the same period of 2025 (up approximately 13.5%).
Source: Israel Central Bureau of Statistics – Monthly Foreign Trade Releases, 2026 · April–September 2026 [5] - 349.7 billion USD
Total import value in September 2026, up 24% from September 2025.
Source: Ministry of Finance, State Revenue Administration – Durable Goods Imports, September 2026 · October 2026 [12] - 3520,486
Passenger vehicles imported in September 2026, versus 19,413 in September 2025 (up 5.5%).
Source: Ministry of Finance, State Revenue Administration – Durable Goods Imports, September 2026 · October 2026 [12]
The August Surge
August 2026 stood out, with imports of NIS 33.3 billion and exports of just NIS 16.0 billion. Exports covered less than half of imports that month, producing a trade deficit of NIS 17.3 billion. [5]
According to the Ministry of Finance, part of the increase in vehicle imports can be explained by the lower US dollar exchange rate in February–June and August, alongside other market factors. [12]
Customs Clearance Times: How Long Does It Really Take?
The Israel Tax Authority publishes an open dataset of clearance times by month, customs house and process type. It covers approximately 210 million declarations from 2023 through August 2026.
- 36approx. 210 million
Approximate number of import declarations released by customs from 2023 through August 2026, according to the clearance-speed dataset.
Source: Israel Tax Authority – Customs Clearance Speed Report (Open Data) · 1.9.2026 [8] - 374.67 → 3.28 days
The weighted average clearance time fell from 4.67 days in 2023 to 3.28 days in 2026, an improvement of approximately 30%.
Source: Israel Tax Authority – Customs Clearance Speed Report (Open Data) · 1.9.2026 [8] - 3865.2 hours
Average clearance time for a standard commercial import declaration (about 2.7 days), based on approximately 4.67 million declarations.
Source: Israel Tax Authority – Customs Clearance Speed Report (Open Data) · 1.9.2026 [8] - 3934.1 hours
Average clearance time for commercial imports handled by courier companies (approximately 1.4 days).
Source: Israel Tax Authority – Customs Clearance Speed Report (Open Data) · 1.9.2026 [8] - 4088.7 hours
Average clearance time for personal imports via couriers, a category representing 93.9% of all declarations in the dataset.
Source: Israel Tax Authority – Customs Clearance Speed Report (Open Data) · 1.9.2026 [8] - 41194.2 hours
Average clearance time for the autonomy route (goods destined for Palestinian Authority areas), approximately 8.1 days. Around 6% of declarations in this route are sent to mandatory inspection.
Source: Israel Tax Authority – Customs Clearance Speed Report (Open Data) · 1.9.2026 [8] - 42approx. 1.5 days
Average clearance time at Ben Gurion Airport Customs House, which processes approximately 120 million declarations, the fastest among customs houses.
Source: Israel Tax Authority – Customs Clearance Speed Report (Open Data) · 1.9.2026 [8] - 430.19%
Share of declarations referred to mandatory inspection out of all declarations in the period.
Source: Israel Tax Authority – Customs Clearance Speed Report (Open Data) · 1.9.2026 [8] - 44approx. 59 days
Average clearance time at Eilat Customs House, the slowest outlier, against a background of low declaration volumes.
Source: Israel Tax Authority – Customs Clearance Speed Report (Open Data) · 1.9.2026 [8]
What Delays Customs Clearance
The overall average conceals substantial differences between channels. Commercial imports through couriers clear in around 34 hours, while standard commercial declarations take about 65 hours. Other routes can take considerably longer. [8]
An encouraging finding is that only 0.19% of declarations were routed to mandatory inspection, while the average clearance time improved by approximately 30% over the multi-year period [8]. Importers should still prepare complete documentation in advance. [8]
Taxes, Personal Imports and International Indicators
Imports are also a major source of government revenue. Most collections come from VAT and purchase tax; customs duties account for a relatively small share.
- 4551.3 billion NIS
Government revenue from VAT on imports in January–September 2026, up 2.9% in real terms.
Source: Ministry of Finance – Budget Execution and Tax Revenue, September 2026 · 8.10.2026 [11] - 4620.5 billion NIS
Revenue from purchase tax on imports in January–September 2026, up 13.1% in real terms.
Source: Ministry of Finance – Budget Execution and Tax Revenue, September 2026 · 8.10.2026 [11] - 471.31 billion NIS
Customs duty revenue in January–September 2026, up 18.1% in real terms, accounting for less than 2% of all import taxes collected.
Source: Ministry of Finance – Budget Execution and Tax Revenue, September 2026 · 8.10.2026 [11] - 4852.8 million
Personal-import parcels valued at USD 75 or less that reached Israel in 2024, with a combined value of approximately USD 1.2 billion.
- 49Rank 26
Israel’s position in the World Bank Logistics Performance Index (LPI 2023), with a score of 3.6 out of 5.
Source: World Bank – Logistics Performance Index 2023 · 21.4.2023 [10] - 503.4 vs. 3.8
Israel’s customs score in the 2023 LPI (3.4), the lowest of its component scores, compared with 3.8 for timeliness.
Source: World Bank – Logistics Performance Index 2023 · 21.4.2023 [10]
Where the Revenue Comes From
Customs duties accounted for less than 2% of import taxes collected in the first nine months of 2026. The largest components were import VAT (NIS 51.3 billion) and purchase tax on imports (NIS 20.5 billion). [11]
Israel ranked 26th in the World Bank Logistics Performance Index. Customs was its weakest component [10], indicating room for improvement even alongside advances in clearance efficiency. [10]
How to Read the Data
Foreign-trade statistics from the Central Bureau of Statistics cover goods recorded by customs. They do not include imports and exports of services, such as software, and may apply different exclusions for diamonds, ships and aircraft. [4]
The same import activity may therefore be represented by different totals: USD 95.5 billion in one series, approximately USD 101 billion in another excluding diamonds and using a different currency conversion, and USD 94.9 billion in the OECD series. Always compare definitions, reference periods, currency and seasonal adjustments. [15]
Glossary: Key Trade Terms
| Term | English | Explanation |
|---|---|---|
| CIF | Cost, Insurance and Freight | Cost, insurance and freight to the destination port; the CBS calculates import values on this basis. |
| TEU | Twenty-foot Equivalent Unit | A container measurement unit equivalent to one twenty-foot container. |
| LPI | Logistics Performance Index | World Bank Logistics Performance Index, scored from 1 to 5. |
| Country of origin | Country of Origin | The country where goods were manufactured or substantially transformed. |
| Country of purchase | Country of Purchase | The country where the goods were purchased, sometimes through an intermediary. |
| Mandatory inspection queue | Mandatory inspection queue | Declarations that customs requires to be inspected before release. |
Frequently Asked Questions
How much merchandise did Israel import in 2025?
According to the Central Bureau of Statistics, Israel imported USD 95.5 billion in merchandise in 2025, an increase of 3.9% from 2024. Excluding diamonds, the shekel-denominated series was approximately NIS 320 billion.
Which country is Israel’s largest source of imports?
China. By country of origin, imports from China in 2025 were approximately USD 20.8 billion excluding diamonds. By region, Europe was the largest source, accounting for about 46% of imports.
How long does customs clearance take in Israel?
According to the Tax Authority clearance-speed dataset, a standard commercial import declaration takes an average of approximately 65 hours (2.7 days) to clear, while commercial courier imports take about 34 hours. The Ben Gurion Airport customs house averaged around 1.5 days.
What share of imports arrives by sea?
Approximately two-thirds of import value (66.7% in 2025) arrived by sea and 32.1% by air. By weight, approximately 99% of goods moved through seaports.
How large is Israel’s merchandise trade deficit in 2026?
The cumulative merchandise trade deficit for January–August 2026 was NIS 103.1 billion, compared with NIS 90.8 billion in the same period of 2025. August alone recorded a deficit of NIS 17.3 billion.
How many containers pass through Israeli ports?
Approximately 3.44 million TEU (twenty-foot equivalent units) passed through Israeli ports in 2025, an increase of around 13.5% from 2024, according to port-sector data.
Why do sources report different import figures?
Differences stem from statistical definitions: whether diamonds, ships and aircraft are included; whether imports are attributed to country of purchase or origin; the currency and exchange rate; and whether seasonal adjustment is applied. This is why every figure is accompanied by its source.
How much tax does Israel collect on imports?
In January–September 2026, approximately NIS 51.3 billion was collected in import VAT, NIS 20.5 billion in purchase tax on imports and NIS 1.31 billion in customs duties, according to the Ministry of Finance.
The figures suggest that preparation is central to efficient customs clearance: correct classification, regulatory approvals and complete documentation. UnitedXP supports importers with international freight forwarding and customs brokerage.
Speak to a SpecialistSources
All figures on this page are drawn from institutional sources: government agencies, the Central Bureau of Statistics, the Knesset and international organizations. The source and publication date appear alongside each fact.
- Israel Central Bureau of Statistics – Imports and Exports by Transport Mode, 2025 · June 2026
- Israel Central Bureau of Statistics – Foreign Trade, December 2025 and Annual Summary · 21.1.2026
- Israel Central Bureau of Statistics – Imports by Country of Origin, 2025 · 28.5.2026
- Israel Central Bureau of Statistics – Israel’s Foreign Trade, January 2026 · 12.2.2026
- Israel Central Bureau of Statistics – Monthly Foreign Trade Releases, 2026 · April–September 2026
- Israel Central Bureau of Statistics – Foreign Trade by Country, 2024 · 21.1.2025
- OECD – International Merchandise Trade Statistics, Israel (via FRED) · 16.3.2026
- Israel Tax Authority – Customs Clearance Speed Report (Open Data) · 1.9.2026
- Israel Ports Company – 2025 Annual Report (Israel Shipping and Ports Authority Data) · 21.1.2026
- World Bank – Logistics Performance Index 2023 · 21.4.2023
- Ministry of Finance – Budget Execution and Tax Revenue, September 2026 · 8.10.2026
- Ministry of Finance, State Revenue Administration – Durable Goods Imports, September 2026 · October 2026
- Knesset Research and Information Center – Analysis of the Tax-Exemption Threshold for Personal Imports · December 2025
- European Commission – EU trade relations with Israel · 2026
- World Bank – WITS, Israel Trade Snapshot · 2025
- Israel Central Bureau of Statistics – Foreign Trade by Country, January–June 2025 · 24.7.2025